Cost savings figures matter, but they don’t tell you whether procurement strategy is helping research move faster. A lower price is a poor outcome if scientists lose hours searching for a product, approvals stall, or a critical material arrives after the experiment window has closed.
For pharmaceutical R&D, the most useful procurement KPIs connect purchasing performance to researcher time, process speed, supplier reliability, policy adoption, and spend control. That broader view helps procurement improve service without weakening governance.
Within a broader pharma procurement strategy, these measures show whether policies, suppliers, and purchasing workflows are supporting research on a daily basis.
What are procurement KPIs?
Procurement key performance indicators are measures used to track how well purchasing and supplier activities support an organization’s goals. The Chartered Institute of Procurement & Supply describes procurement KPIs as measures of internal and external activity across value, time, quality, and cost.
Why cost savings is not enough for pharmaceutical R&D
Traditional procurement reporting often centers on negotiated savings, spend under management, and purchase-price variance. These measures still matter, but they simply don’t reflect the full effect of procurement on research operations.
A team can hit a savings target while scientists spend more time sourcing, exceptions increase, or suppliers miss promised delivery dates. The opposite can also happen: a change that raises the unit price slightly may reduce delays, manual effort, or experiment risk enough to create more value overall.
For a broader benchmark, APQC groups procurement measures into cost effectiveness, cycle time, process efficiency, and staff productivity. Pharmaceutical R&D teams can build on that structure by adding measures tied to scientist experience and the reliability of specialized suppliers.
8 procurement KPIs that matter in pharmaceutical R&D
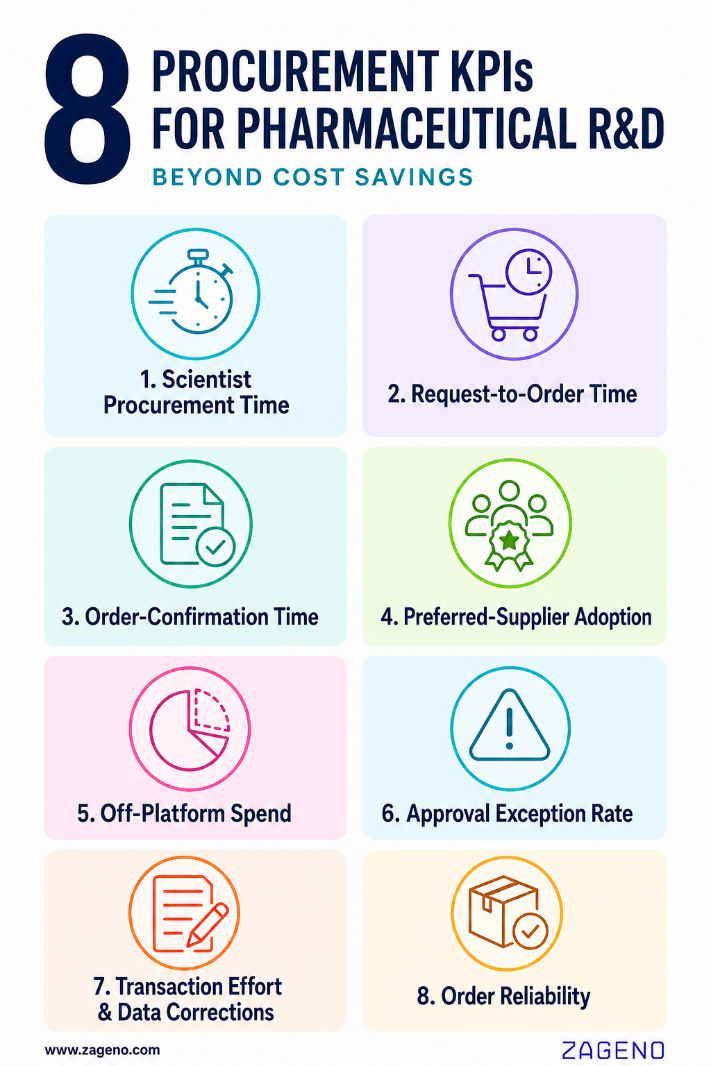
The right mix will vary by organization. Start with the measures that answer a real operating question, then add detail only when it changes a decision.
| KPI | How to measure it | What it tells you |
|---|---|---|
| 1. Scientist procurement time | Hours per scientist per week spent finding, comparing, ordering, and tracking supplies. | Shows whether purchasing friction is taking time away from research. |
| 2. Request-to-order time | Median time from a complete request to an approved purchase order or order submission. | Reveals approval, sourcing, and workflow bottlenecks. |
| 3. Order-confirmation time | Typical time from order submission to supplier confirmation, along with the time required for 90% of orders to be confirmed. | Highlights slow or inconsistent supplier responses. |
| 4. Preferred-supplier adoption | Share of eligible order lines or spend placed with preferred suppliers. | Tests whether category strategy works in everyday purchasing. |
| 5. Off-platform spend | Share of addressable spend purchased outside the approved workflow. | Identifies visibility gaps and purchasing paths that need attention. |
| 6. Approval exception rate | Share of requests that are rerouted, overridden, returned, or handled manually. | Shows where policies or workflows do not match real research needs. |
| 7. Transaction effort and data corrections | Purchase orders and invoices per project or experiment, together with the share of transactions requiring manual corrections. | Shows fragmentation, processing load, and data-quality problems. |
| 8. Order reliability | Backorders, cancellations, substitutions, and promised-date accuracy, tracked by supplier and category. | Signals delivery and continuity risk for time-sensitive materials. |
5 scorecard-building steps
How procurement analytics supports the scorecard
A useful scorecard depends on connected purchasing data. Requisitions and approvals may live in a P2P system, financial records in an ERP, supplier updates in portals, and research context in separate scientific systems. The goal is not to make one tool own every record. It is to connect trustworthy fields and maintain clear ownership.
ZAGENO’s lab spend analytics capability helps procurement and finance teams review purchasing activity by factors such as timeframe, user, category, location, cost center, project code, and supplier. Scientific procurement orchestration connects that purchasing workflow with researchers, suppliers, and existing enterprise systems.
Supplier scorecards should also be used as a basis for improvement, not just ranking. CIPS guidance on supplier performance recommends using KPIs and scorecards to monitor performance. For purchasing that supports API manufacturing or other regulated activities, teams should also align measures with applicable quality requirements. For example, FDA Q7A guidance calls for systems to evaluate suppliers of critical materials.
What not to put on the scorecard
- Total spend without context. Spend is an input, not a performance result.
- A company-wide average that hides site, category, or supplier differences.
- Catalog adoption without checking whether scientists can find suitable products.
- Purchase-order count without normalizing for project activity, supplier structure, or spend.
- A target copied from another industry without testing whether it fits R&D purchasing.
A better measure of procurement value
The aim is not to produce more metrics. It is to show whether procurement is making research easier to run. A balanced scorecard helps teams protect scientist time, reduce unnecessary handling, improve supplier decisions, and maintain visibility without forcing every purchase into the same mold.
If your current reporting stops at savings, begin with three questions:
- How much researcher time does purchasing consume?
- Where does a request wait?
- Which supplier or workflow problems recur?
Those answers will point to the first KPIs worth improving.
Frequently asked questions about procurement KPIs
- What are the most important procurement KPIs?
The most useful set usually combines cost, cycle time, process effort, policy adoption, and supplier performance. Pharmaceutical R&D teams should also measure scientist procurement time and the reliability of time-sensitive orders. - How do you measure procurement performance beyond savings?
Track whether procurement reduces the time and effort required to buy, improves supplier reliability, increases use of approved purchasing paths, and gives teams accurate spend and workflow data. - What is the difference between procurement analytics and spend analytics?
Spend analytics focuses on where money is being spent, with whom, and on what. Procurement analytics is broader and can include cycle times, workflow exceptions, supplier performance, adoption, data quality, and staff productivity. - How should pharmaceutical R&D teams measure supplier performance?
Use measures that reflect the material and its research impact, such as confirmation time, promised-date accuracy, backorders, cancellations, substitutions, quality events, and responsiveness. Segment results by category and criticality. - How often should procurement KPIs be reviewed?
Operational measures may be reviewed weekly or monthly. Executive scorecards are often reviewed monthly or quarterly. Definitions should remain stable long enough to show a trend, while the KPI set itself should be reassessed as priorities change.
Ready to measure what matters?
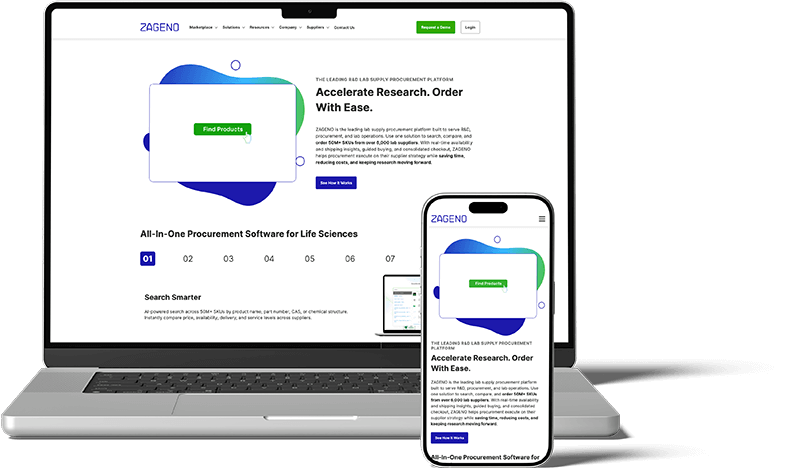
See how ZAGENO brings scientific purchasing, supplier access, approvals, and spend data into one coordinated workflow for pharmaceutical R&D.
Related resources